


Loveland by the numbers.
What is for sale and what has sold recently — counts and typical values from the MLS, not an appraisal or a forecast.
As of September 23, 2026
For sale right now
- 23 Active
- 15 Pending
-
Homes for sale now
Active homes are on the market. Pending homes are already under contract with a buyer, so they are not available to buy — they are counted here because they show how much of the area's inventory has already been spoken for. - 23
- 15 more are pending
-
Typical asking price
Line every sale up from the lowest price to the highest. The typical figure is the one in the middle — half the sales are above it, half below. It is not an average: one unusually high or low sale moves an average, but it cannot move the middle. That is why the middle is the figure shown. - $370,000
- of the homes for sale now
- New in the last 30 days
- 19
- listings with an on-market date in the window
What sold homes brought
-
Typical sold price
Line every sale up from the lowest price to the highest. The typical figure is the one in the middle — half the sales are above it, half below. It is not an average: one unusually high or low sale moves an average, but it cannot move the middle. That is why the middle is the figure shown. - $388,000
- over those 58 sales
- Average sale $512,345 — 32.0% above typical
-
Sold for % of asking price
Each sale's price compared with that home's final asking price, then the middle result. Above 100% means the typical home sold for more than it was last asking; below 100% means less. Seller-paid closing costs are not recorded in this data, so a sale that included them netted the seller less than this figure shows. - 100.0%
- typical sale against its final asking price
-
Typical price per square foot
Each sale's price divided by the living area the MLS records for that home, then the middle result. Living area is not recorded for every sale, and seller-paid closing costs are not recorded at all, so this is a rough way to compare homes of different sizes rather than a valuation of any one of them. - $213
- for the homes that sold
How long it took
-
Typical days on market
How long the middle home sat for sale before it sold, counted the way the MLS records it. Half the homes that sold took less time than this and half took more. - 4
- days for the homes that sold, as the MLS records it
- Sold in the last 90 days
- 58
- closed sales · 62 a year ago
Covers homes with Loveland addresses: houses, condos and townhomes (land, commercial, multi-family investment and rental listings excluded). "Typical" is the middle value (the median): half the homes are above it and half below. We show it rather than an average because a few unusually high or low sales can pull an average away from the middle; where an average is shown, it is the average of the same sales. A typical value is reported only when at least 5 listings or sales are in the window. "Sold for % of asking price" compares each sale price with that home's final asking price, and price per square foot uses the living area the MLS records — seller-paid closing costs are not recorded in this data, so both figures overstate what a seller actually netted on any sale that included them. "A year ago" is the same 90-day window one year earlier. We show it only where the two windows differ by more than the normal variation between two groups of sales that size — so a figure with no year-ago number beside it means last year's was too close to this year's to tell apart, or last year's window had too few sales to compare — not that it is missing. Data courtesy of the MLS of Greater Cincinnati. Information is deemed reliable but not guaranteed — independently verify all details. These figures are not an appraisal or an estimate of any specific home's value; for a specific home, ask us for a comparative market analysis.
A few things to know about Loveland.
- Trailhead access to the Little Miami Scenic Trail, a paved rail-trail running more than 78 miles, with the downtown trailhead at Nisbet Park
- Downtown along the Little Miami River with restaurants, breweries, and shops
- One of the few Ohio cities whose boundaries fall within three counties — Hamilton, Clermont, and Warren
- Quick access to I-275 (Exit 52), with SR-48 running through town and US-22/SR-3 nearby
- Mix of single-family stock from the 1970s–2000s alongside newer subdivisions in Symmes and Hamilton townships
Loveland, in plain English.
Loveland is built around the Little Miami River and the bike trail that runs through it. The downtown sits a short walk from the Nisbet Park trailhead and combines independent restaurants, breweries, and shops with weekend foot traffic from cyclists, runners, and other trail users.
Loveland's boundaries span three counties — Hamilton, Clermont, and Warren — and the housing market reflects that mix: older homes near downtown, post-war subdivisions throughout, and newer construction at the edges.
Real estate and homes in Loveland.
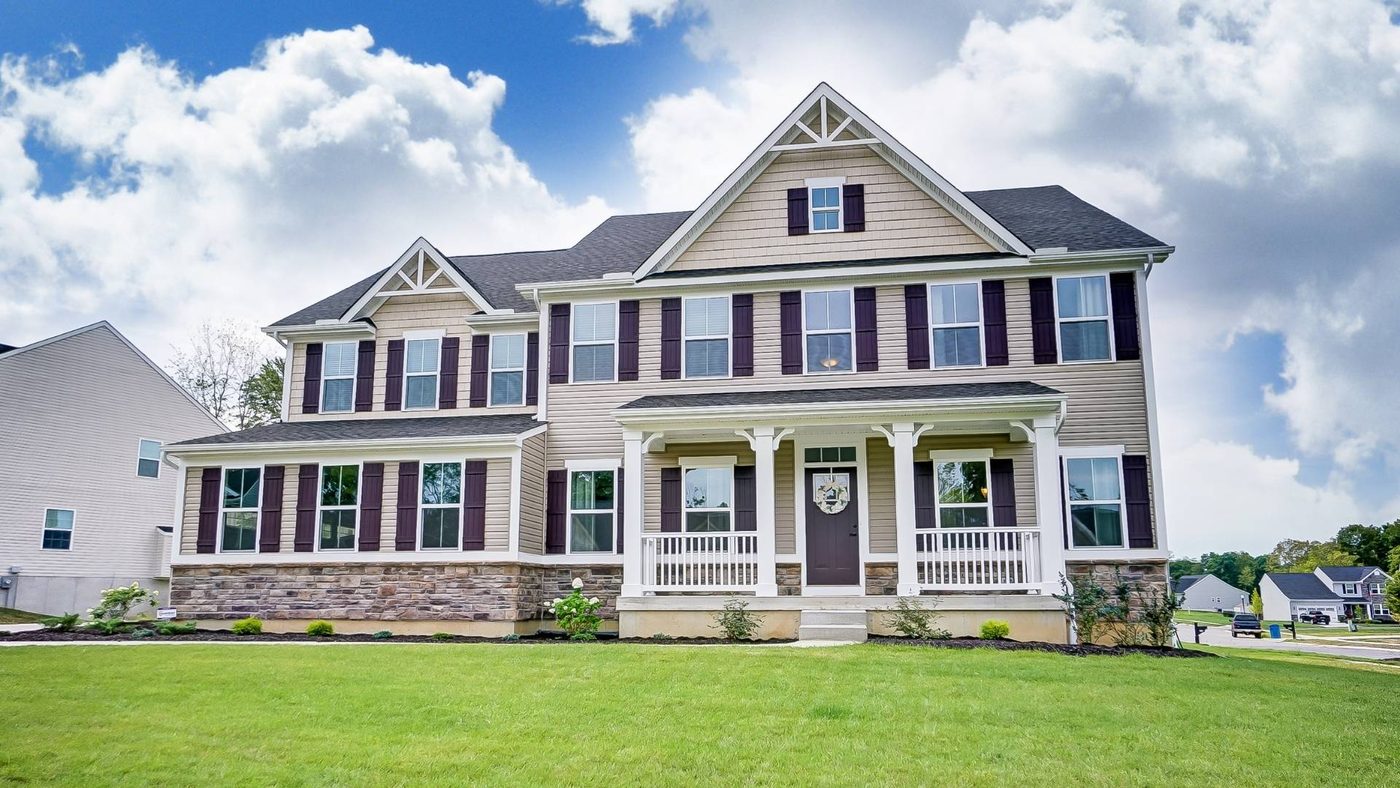
The 45140 market spans a range of housing, from older homes near the downtown core to post-war subdivisions and newer construction toward the city's edges. Because current values, inventory, and days on market shift through the year, we point buyers and sellers to our live home search for up-to-date figures rather than a fixed number.
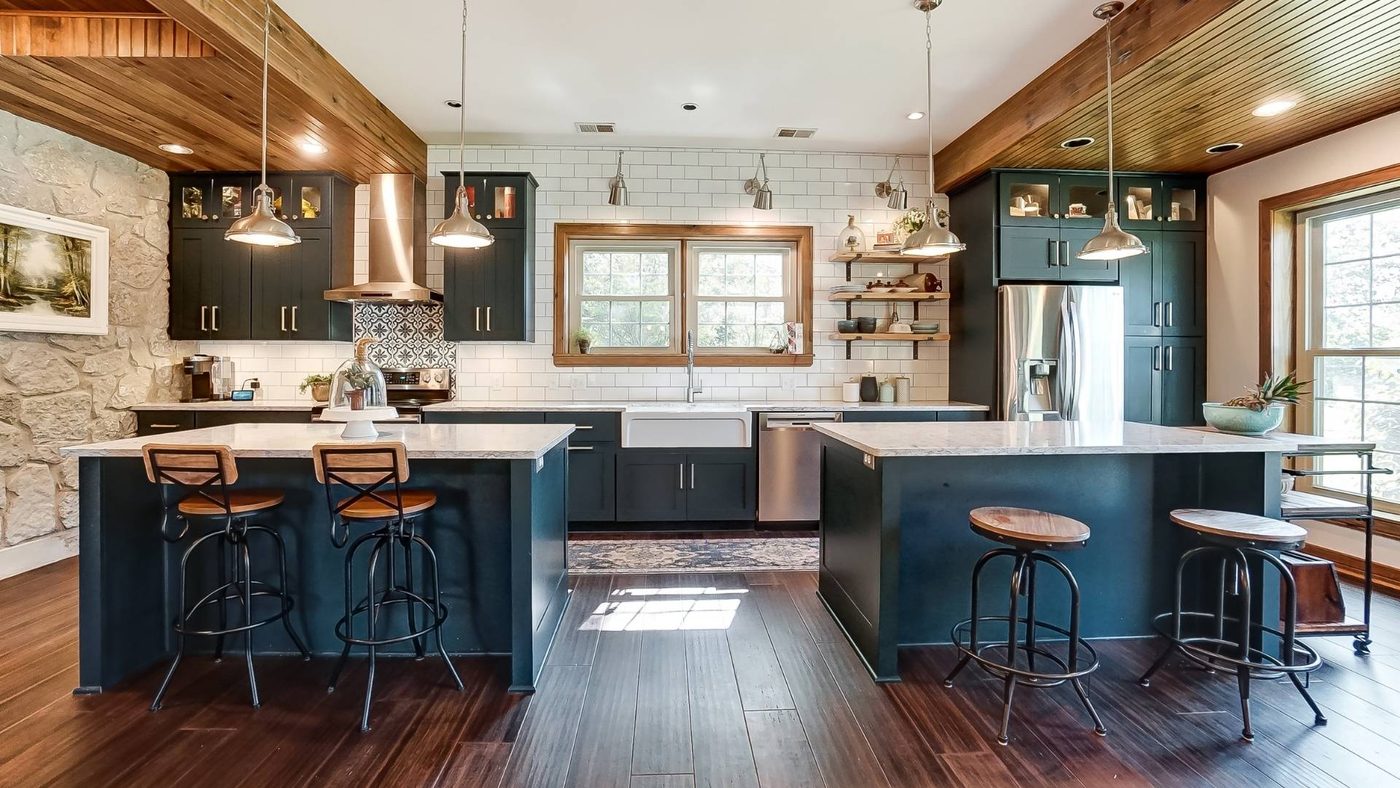
Updated homes with modern systems and refreshed kitchens and baths tend to draw the most interest. Newer construction shows up in smaller subdivisions on the edges of the city and in parts of Symmes Township.
Market statistics referenced here are approximations based on recent activity in this area. They are useful for context — your Ernst Team agent can pull current comparable sales for any specific home or block.
What's around Loveland.
Downtown Loveland includes Paxton's Grill, Tano Bistro, Narrow Path Brewing, and Graeter's Ice Cream, along with a rotation of seasonal events along the river. Loveland Castle (Château Laroche) sits on the bank of the Little Miami River a few miles north of downtown.
Nisbet Park anchors the downtown at the river and the trail, with an amphitheater used for concerts and community events. Larger retail in the Deerfield Township area is a short drive away.
Schools serving Loveland.
Loveland City Schools serves most of the 45140 area, with portions also served by Little Miami Local Schools depending on address. School-quality assessments are personal and change over time. For current ratings, boundary maps, and program details, we encourage you to consult publicly available resources such as GreatSchools.org, the Ohio Department of Education and Workforce, and the district's own website. Your Ernst Team agent is happy to point you to additional public resources.
Buying in Loveland, answered.
Which county is a Loveland home in?
It depends on the parcel, not the mailing address. Loveland is one of the few Ohio cities whose boundaries fall within three counties: Hamilton, Clermont and Warren. Look the parcel up with the matching county auditor to confirm the jurisdiction and the current tax figure. It matters because you are underwriting a monthly payment rather than a purchase price, and the tax line differs by jurisdiction.
Which school district serves a Loveland address?
Loveland City Schools serves most of the 45140 area, and portions are served by other districts, including Little Miami Local Schools, depending on the address, so a Loveland mailing address does not settle it. Verify the parcel with the county auditor, cross-check the district's official boundary map, and review the district's registration and residency rules. For ratings and program details, consult public resources such as the Ohio Department of Education and Workforce.
What should I check before buying a home near the Loveland bike trail?
Check the lot against FEMA flood maps, and ask for any elevation certificate and the seller's flood history, since parts of the area sit near the Little Miami River. Order a title report and a survey to find trail or maintenance easements and riparian setbacks that can limit fences or landscaping. Then visit on weekday mornings, weekday evenings and at weekend peak times to gauge trail activity, noise and parking.
Where does the Little Miami Scenic Trail go from Loveland?
The Little Miami Scenic Trail is a paved rail-trail that runs more than 78 miles. Loveland's downtown trailhead is at Nisbet Park, which also has an amphitheater used for concerts and community events. From Loveland the trail runs south to Milford, about 9.5 miles, and north through Morrow and beyond.
What kinds of homes are in Loveland?
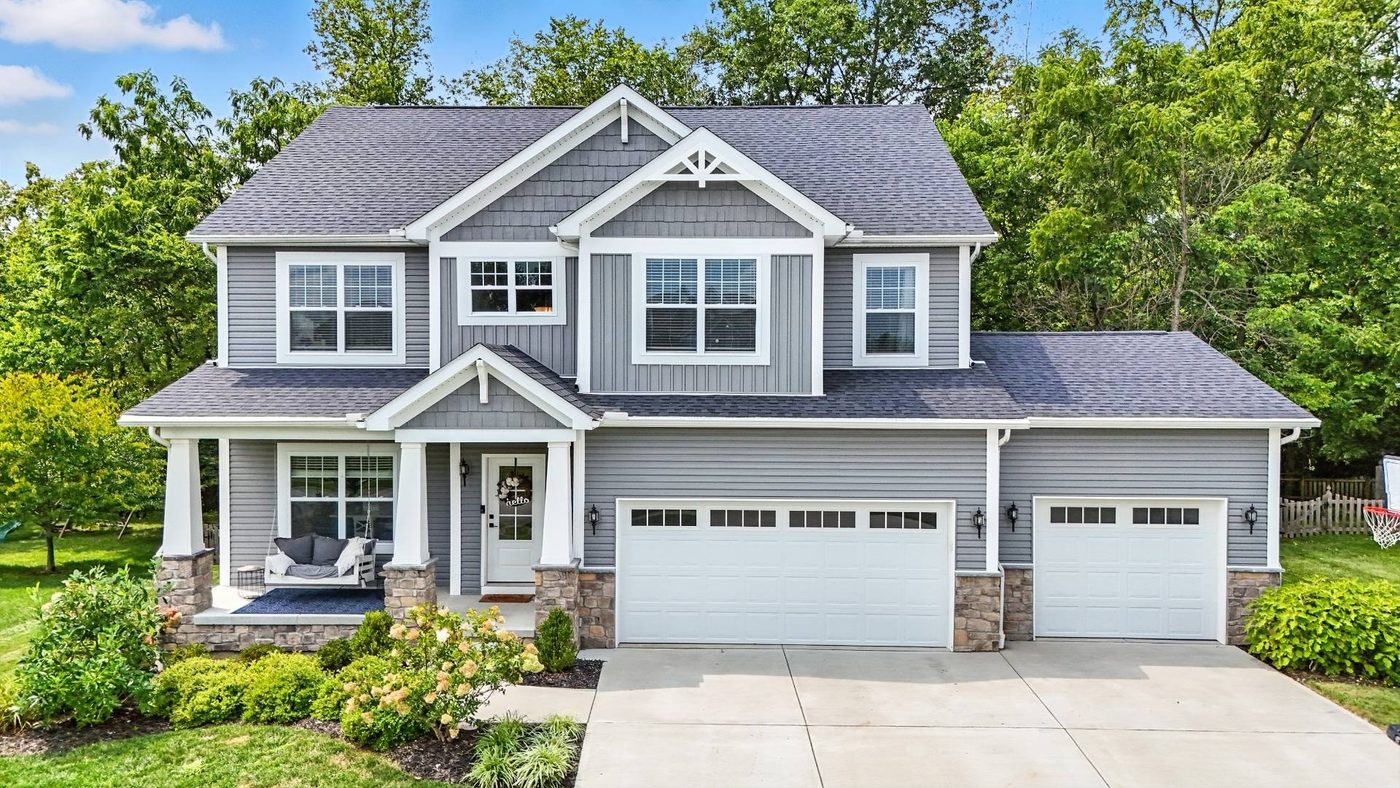
The 45140 area covers older homes near the downtown core, post-war subdivisions throughout, and newer construction toward the city's edges, much of it single-family stock built from the 1970s to the 2000s. Newer construction shows up in smaller subdivisions at the edges of the city and in parts of Symmes Township. Values and inventory shift through the year, so use the live home search for current figures.
Browse other neighborhoods we know.





Loveland doesn't move on its own.
The figures at the top of this page are Loveland's. They sit inside a metro that shares the same rate environment and inventory cycle — see the live figures for the wider Cincinnati market, then come back and read Loveland against it.
Moving here from out of the area? Start with our guide to relocating to Cincinnati — buying a home from another state step by step, and the communities we work in with live figures to compare before you pick an area to tour.
Considering Loveland?
Tell us what you're hoping to find. We'll send a short, honest read on Loveland — what's actually available and what comparable homes are doing right now.