


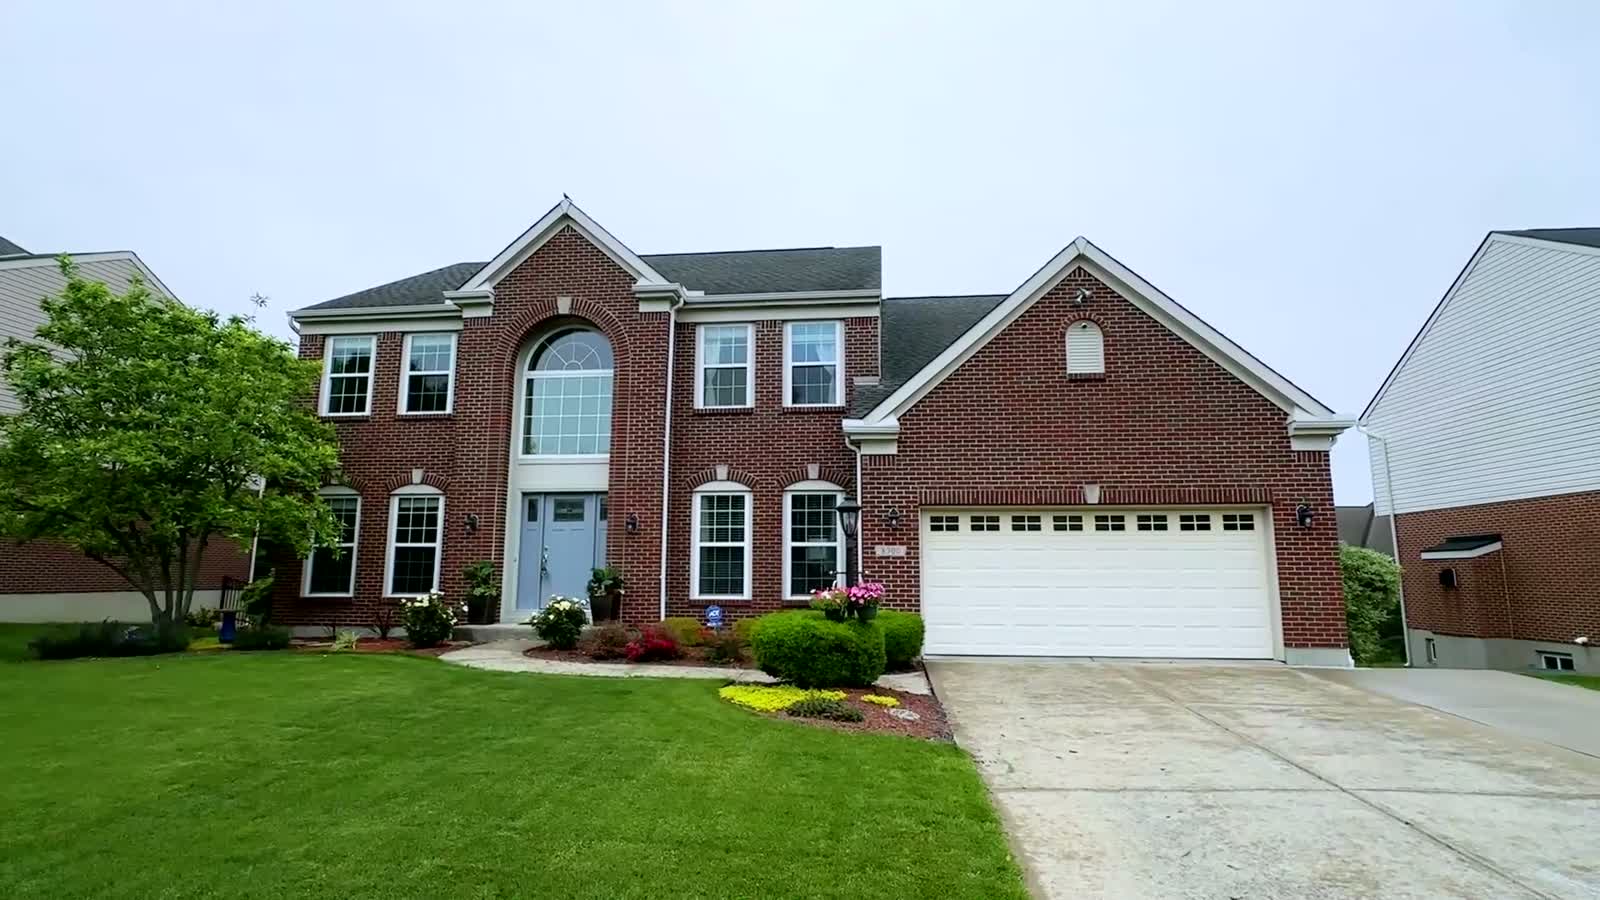
How Much Is Your Montgomery Home Worth?
Request a Personalized Seller Evaluation, prepared by one of our agents.
See a suggested range for your home before you talk to anyone.
Type your address. If your home isn't currently listed for sale, we'll show a suggested range built from recent comparable sales near you — a suggested range based on comparable sales, not an appraisal, and never a single number. Then pick the Seller Brief or the Seller Dossier and an agent turns the range into a real recommendation for your home.
An algorithm has never stood in your kitchen.
An automated estimate works from public records alone. We work directly with you to build a suggested range based on a CMA, not an appraisal — and a recommended price — because the details that move a home's value are the ones only you know. Choose the depth that fits: a quick Seller Brief, or a Seller Dossier that factors in the condition and update history public records have no field for.
Seller Brief
A fast market read — recent comparable sales and current conditions for your address. Just your contact info.
Seller Dossier
A deeper, personalized valuation. A few quick questions about your home's condition and updates — the value drivers public data has no field for — so the range reflects your home rather than homes like it.
Request Your Seller Evaluation
Pick Brief or Dossier below. After you submit, a licensed Ernst Team agent calls you back — in 10 minutes or less, 8am–8pm ET, 7 days — with comparable Montgomery sales, current 45242 conditions, and what your home is realistically positioned to do today.
Thanks — your request is in. A licensed Ernst Team agent is contacting you.
We answer the phone (8am–8pm ET, 7 days). Prefer to talk right now? Call the team at (513) 866-3700.
Montgomery by the numbers.
What is for sale and what has sold recently — counts and typical values from the MLS, not an appraisal or a forecast.
As of September 23, 2026
For sale right now
- 22 Active
- 22 Pending
-
Homes for sale now
Active homes are on the market. Pending homes are already under contract with a buyer, so they are not available to buy — they are counted here because they show how much of the area's inventory has already been spoken for. - 22
- 22 more are pending
-
Typical asking price
Line every sale up from the lowest price to the highest. The typical figure is the one in the middle — half the sales are above it, half below. It is not an average: one unusually high or low sale moves an average, but it cannot move the middle. That is why the middle is the figure shown. - $759,450
- of the homes for sale now
- New in the last 30 days
- 17
- listings with an on-market date in the window
What sold homes brought
-
Typical sold price
Line every sale up from the lowest price to the highest. The typical figure is the one in the middle — half the sales are above it, half below. It is not an average: one unusually high or low sale moves an average, but it cannot move the middle. That is why the middle is the figure shown. - $766,750
- over those 42 sales
- Average sale $873,162 — 13.9% above typical
-
Sold for % of asking price
Each sale's price compared with that home's final asking price, then the middle result. Above 100% means the typical home sold for more than it was last asking; below 100% means less. Seller-paid closing costs are not recorded in this data, so a sale that included them netted the seller less than this figure shows. - 100.0%
- typical sale against its final asking price
-
Typical price per square foot
Each sale's price divided by the living area the MLS records for that home, then the middle result. Living area is not recorded for every sale, and seller-paid closing costs are not recorded at all, so this is a rough way to compare homes of different sizes rather than a valuation of any one of them. - $251
- for the homes that sold
How long it took
-
Typical days on market
How long the middle home sat for sale before it sold, counted the way the MLS records it. Half the homes that sold took less time than this and half took more. - 4
- days for the homes that sold, as the MLS records it
- Sold in the last 90 days
- 42
- closed sales · 48 a year ago
Covers homes with Montgomery addresses: houses, condos and townhomes (land, commercial, multi-family investment and rental listings excluded). "Typical" is the middle value (the median): half the homes are above it and half below. We show it rather than an average because a few unusually high or low sales can pull an average away from the middle; where an average is shown, it is the average of the same sales. A typical value is reported only when at least 5 listings or sales are in the window. "Sold for % of asking price" compares each sale price with that home's final asking price, and price per square foot uses the living area the MLS records — seller-paid closing costs are not recorded in this data, so both figures overstate what a seller actually netted on any sale that included them. "A year ago" is the same 90-day window one year earlier. We show it only where the two windows differ by more than the normal variation between two groups of sales that size — so a figure with no year-ago number beside it means last year's was too close to this year's to tell apart, or last year's window had too few sales to compare — not that it is missing. Data courtesy of the MLS of Greater Cincinnati. Information is deemed reliable but not guaranteed — independently verify all details. These figures are not an appraisal or an estimate of any specific home's value; for a specific home, ask us for a comparative market analysis.
What is your Montgomery property worth right now?
Montgomery's walkable village character, established neighborhoods, and proximity to major employment corridors keep it in steady demand. Within 45242, the spread between two similar homes usually comes down to condition, update history, and setting rather than square footage alone. A personalized evaluation starts from your home rather than the average.
Market context like that is a starting point, not a substitute for a real read on your home — what comparable Montgomery properties have actually sold for this quarter, which trends apply to your block, and how today's buyer pool views your specific home. That's what a personalized seller evaluation gives you.
Curious what you'd be competing with? See what's for sale in Montgomery right now →
What actually moves a sale price here.
Montgomery sits at the upper end of the price bands we work in, and the higher the band, the less a price-per-square-foot average tells you. Buyers at this level are comparing finish quality, not floor area — a kitchen and primary bath that read as current can carry a house past a larger, dated competitor, and the reverse is just as true. The second Montgomery-specific factor is setting: lot size and mature tree cover vary widely between the established streets near the Heritage District and the later subdivisions, and that variation is priced. For a seller the useful question is not 'what do homes here sell for' but 'which of the two or three houses a buyer will see the same week does mine beat, and on what'.
Finish level, not floor area
At this price band the per-square-foot average is close to meaningless. What a buyer is comparing is how current the kitchen, primary bath and mechanicals read against the other homes they saw that week.
Lot and setting
Lot size, grade and mature tree cover vary widely across Montgomery, and the difference is priced. It is one of the biggest gaps between an automated estimate and what a buyer actually offers.
Who you are competing with this week
In a smaller, higher-priced market the relevant comparison is the handful of homes genuinely competing with yours right now — not a twelve-month average of everything that sold.
None of the above is something an automated estimate can read off a parcel record — which is why the number it gives you and the number a buyer writes are so often different. A seller evaluation from one of our agents starts from your home, in Montgomery, as it is today.
Selling in Montgomery, answered.
What is my Montgomery home worth?
Montgomery sits at the upper end of the price bands we work in, and at that level a price-per-square-foot average tells you very little. Buyers here are comparing finish quality, lot and setting against the small number of homes genuinely competing with yours in the same week — a current kitchen and primary bath can carry a house past a larger, dated one. The market figures on this page, when available, show what the wider Montgomery market has been doing; a seller evaluation reads your home against its actual competition, at no cost to you.
Does my lot size matter more in Montgomery than elsewhere?
It carries more weight here than in most of the places we list, because lot size, grade and mature tree cover vary widely between the established streets near the Heritage District and the later subdivisions. That variation gets priced by buyers and is one of the larger gaps between an automated estimate and a real offer, since a parcel record shows acreage but not setting.
How many homes am I competing with when I list in Montgomery?
Usually a small number, which is why the metro-wide averages are the wrong lens. The count of Montgomery homes currently for sale and currently pending is in the market figures on this page when they are available, with the as-of date beside them. The practical question for pricing is narrower still: of those, which two or three does a buyer see the same week as yours, and what does yours beat them on? That is a judgment about specific live listings, and it is the core of the evaluation.
Want the mechanics rather than the local detail? How a home valuation is actually performed walks through what a comparative market analysis is, how it differs from an appraisal, and what each one is good for.